The June 5, 2026 national trailer inventory was collected by field staff and volunteers submitting data through a structured form. Because respondents entered values manually in free-text fields — rather than selecting from a controlled list — the raw dataset reflects the full range of real-world data entry: inconsistent units, varied date formats, truncated brand names, and missing or ambiguous values.
This report documents the cleaning and standardization pipeline applied before analysis. Three fields required significant transformation: trailer length (inconsistent formats), model year (mixed date representations), and trailer make (free-form brand names with no canonical list). Each field was parsed with custom logic, and every transformation decision is surfaced in the tables below so the methodology is fully auditable.
Of 2,099 records received, all 2,099 were successfully geocoded to a street address.
| Raw Input | Cleaned length_ft | Parse method |
|---|
| Raw Input | Cleaned model_year | Age in 2026 |
|---|
| Raw Input | Canonical Make | Records affected |
|---|
Each column compares a RIM count against Element inventory. Apr RIM = active trailers recorded in April 2026. Jun RIM = active trailers recorded June 5, 2026.
Positive difference = RIM shows more trailers than Element expects. Negative = RIM shows fewer. RIM Change (Apr→Jun) tracks whether each region improved or declined between the two pulls.
| Region | Apr Inventory | Apr RIM | Apr Diff | Jun Inventory | Jun RIM | Jun Diff | RIM Change |
|---|
3,050 trailers. A fleet built over three decades.
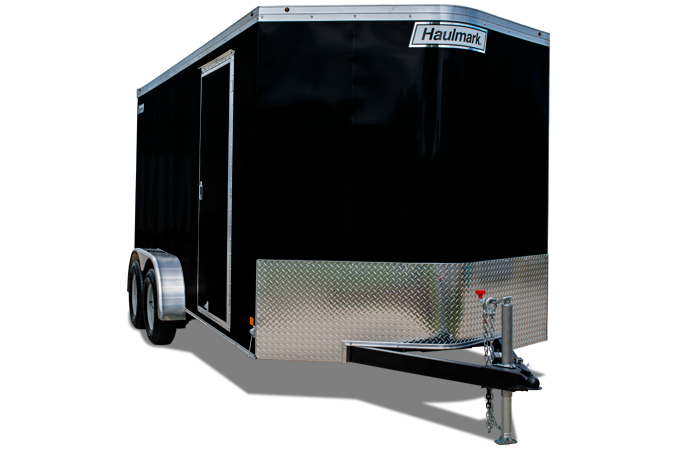
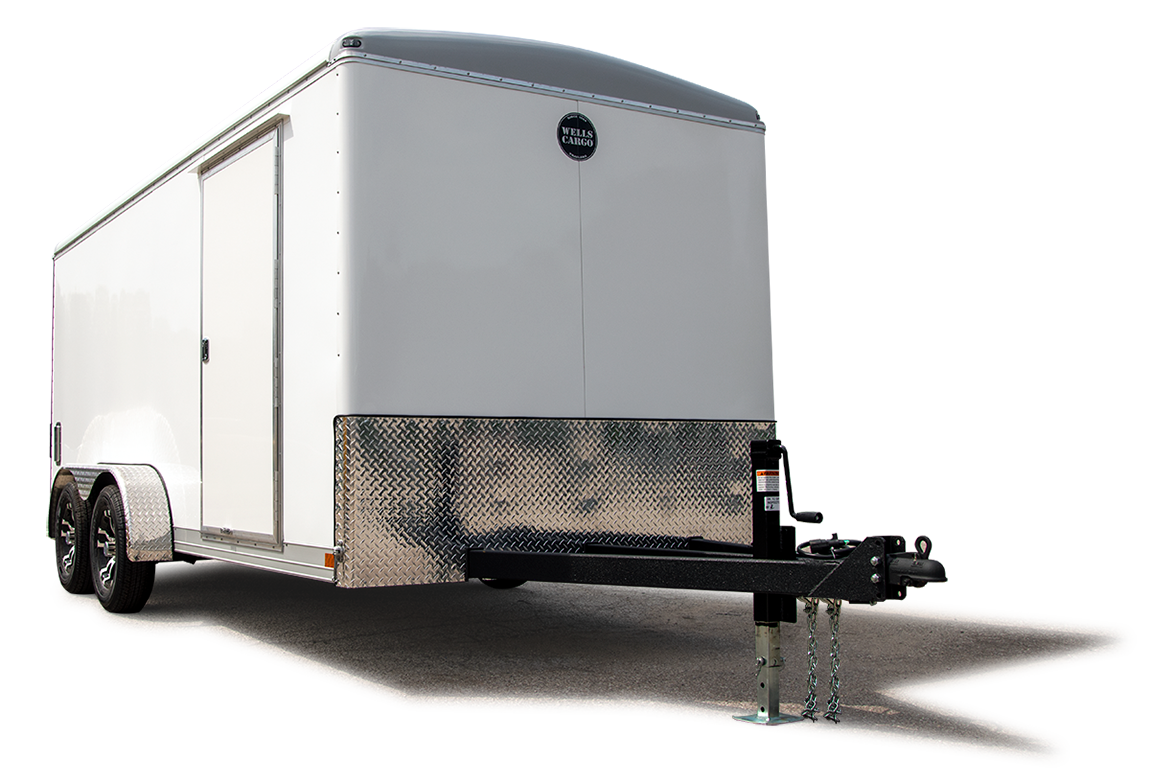
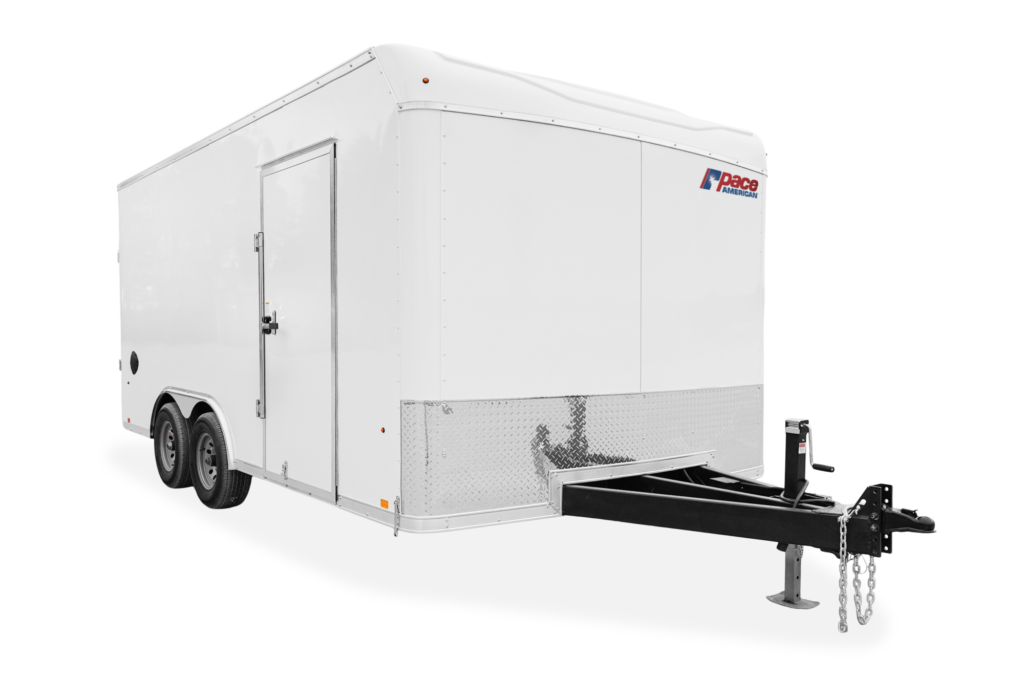
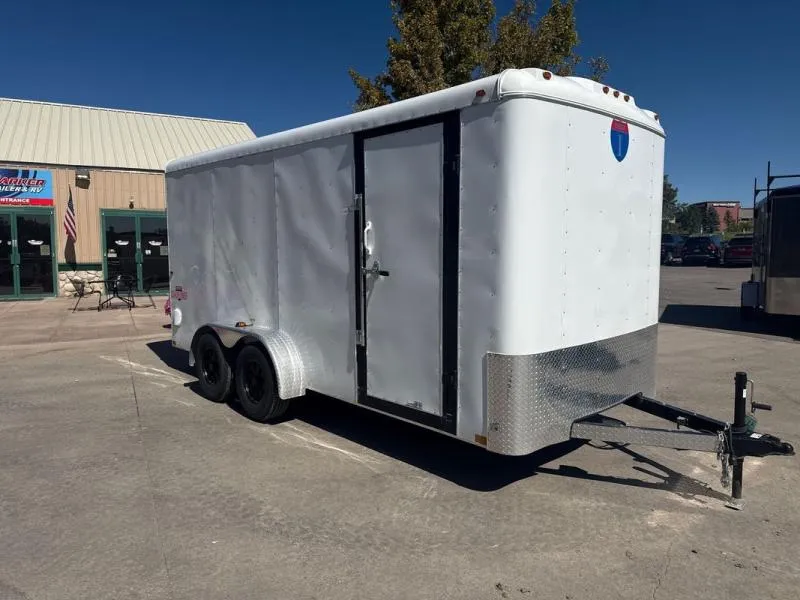
The three most common brands average 18–23 years in service. The images below show factory-new stock — field units will vary based on age, use, and chapter modifications.

This inventory joins two independent lists of trailers — what the Red Cross fleet system officially has on file, and what chapter teams physically found and recorded in the field — then layers in government VIN details and Red Cross geography. Each trailer is matched between the lists by its VIN (the 17-character serial number) and shown once.
RIM field survey — what chapter teams recorded in person: condition, tires, hitch, local contacts, and on-the-ground location.
Element fleet system — the Red Cross's official asset database (the "system of record"): VIN, unit number, plate, status, in-service date.
NHTSA VIN decode — the U.S. vehicle agency's free lookup that turns a VIN into authoritative make, model, year, body type, and axle count.
Red Cross geography — each trailer is placed in its Chapter, Region, and Division (from its address / ZIP) for regional reporting.
| Color | Source | Example Fields |
|---|---|---|
| Gray | Key | VIN, Unit # |
| Blue | Element fleet system | Status, plate, driver, in-service date |
| Red | RIM field survey | Condition, tire size, hitch, contacts |
| Green | NHTSA VIN decode | Make, model, year, axles |
| Orange | Pulled from notes | Phone, capacity, decom / missing flags |
| Purple | Merged | Best address from either source |
| Gray | Enriched | Map coordinates, Chapter / Region / Division |
Duplicate VINs — the same VIN entered at two or more sites. Kept side by side so the team picks the right one.
Typo twins — near-identical VINs from look-alike characters (O↔0, S↔5, I↔1, B↔8, Z↔2, G↔6). Graded A (near-certain) / B (likely) / C (review).
Impossible VINs — a real VIN can never contain the letters I, O, or Q, so any that does is a guaranteed typo.
Missing VINs — rows with no VIN recorded; these can't be matched between the two systems.
Placeholder VINs — entries like 0 or 00 that aren't real VINs.
VIN — Vehicle Identification Number, the 17-character serial unique to each trailer.
Element — the Red Cross fleet-management system (the system of record).
RIM — the field survey chapters complete when they physically inspect a trailer.
System of record — the official source of truth (Element), used to resolve conflicts.
Geocoded — given map coordinates from its address so it appears on the map.
What the VINs Tell Us:
A Three-Source Intelligence Study of ARC's Trailer Fleet
By cross-referencing the Element fleet management system, the June 2026 RIM extract, and the NHTSA free VIN database, we now have the most complete picture of the American Red Cross trailer fleet ever assembled — and it reveals significant gaps, risks, and opportunities that neither system alone could show.
Three-Source Coverage Map
How many trailers appear in each data source
Key Findings
Fleet Age (Model Year)
Distribution of 2,323 VIN-decoded trailers
Top Manufacturers
From NHTSA VIN decode — not in either source system
Axle Count Distribution
Mission-critical for tow vehicle matching — new data
Procurement Era Clusters
Fleet built in waves — reveals replacement planning gaps
Operational Risk Flags
Issues visible only by joining all three sources
Full Study
Abstract
The American Red Cross maintains a national fleet of approximately 2,200+ trailers used for disaster response operations. Until June 2026, fleet data was siloed across two systems: the Element fleet management platform (authoritative for ownership, registration, and status) and the chapter-maintained RIM system (authoritative for physical condition, location, and inspection history). Neither system contained manufacturer identity, model year, or axle count — facts deterministically decodable from the VIN number embedded in every record. This study merges all three sources into a single master dataset and quantifies the resulting intelligence gain.
Background
The trailer fleet is a critical logistics asset for ARC disaster response. Trailers carry cots, blankets, casework supplies, and field equipment to active disasters. Fleet condition, location, and capability directly affect ARC's ability to mobilize. Despite this operational importance, no single data view of the fleet existed. The Element system tracks ownership and status. Field teams record trailers in RIM, capturing physical condition and location. The NHTSA's free Vehicle Product Information Catalog (vPIC) API can decode any 17-character VIN into manufacturer, model year, axle count, trailer length, and body type in milliseconds — but this had never been applied to the trailer dataset.
Methodology
Three datasets were joined using the VIN as the primary key:
- Source 1 — Element fleet system: 2,242 records. Authoritative for unit status (Active/Sold/Surplus), in-service date, fixed asset number, license plate, driver assignment, and DOT number.
- Source 2 — June 2026 field survey: 2,099 records. Authoritative for physical location (geocoded), condition ratings, inspection dates, hitch/tire data, and operational notes.
- Source 3 — NHTSA vPIC API: Free, unauthenticated batch API. Decoded 2,323 VINs in 47 API calls (~90 seconds). Returns manufacturer, model year, axle count, trailer length, and body type. Clean decode rate: 54%; partial decode: 46% (partial still returns useful manufacturer and year data).
The master dataset contains unique VIN records spanning all three sources. Join was performed in Python using exact VIN string matching. No fuzzy matching was required.
Finding 1: Coverage Asymmetry
Only trailers appear in both Element and RIM — meaning both systems have a confirmed physical record and an administrative record. trailers exist in Element but have no corresponding RIM record: the fleet system knows they exist, but no field team has assessed their current physical condition, location confirmation, or operational status. Conversely, trailers appear in RIM but not in Element — these are assets being used operationally that have no administrative record. This asymmetry is a fleet governance gap: trailers without RIM records may be in unknown condition; trailers without Element records may lack proper registration, insurance, or accountability.
Finding 2: Fleet Age Is Not Tracked — But Is Now Known
Neither source system contains model year as a data field. The NHTSA decode reveals the fleet's age profile for the first time. The median trailer has been in service for approximately years. The largest procurement cohort spans 2006–2009, meaning the bulk of the fleet is now 17–20 years old. The oldest active trailers date to 1982 — over 40 years in service. A small cohort of 2018 trailers (132 units, the Kaufman batch) represents the most recent significant procurement. The virtual absence of trailers from 2020–2024 suggests procurement halted during COVID and has not recovered — a fleet renewal gap that should trigger capital planning attention.
Finding 3: Manufacturer Concentration and Brand Fragmentation
The fleet spans distinct manufacturers — a degree of brand fragmentation that complicates maintenance standardization and parts sourcing. American Cargo Group (416 units, formerly Wells Cargo) is the dominant supplier, followed by Forest River (236) and Kaufman (119). However, 50+ manufacturers are represented by fewer than 10 units each. This long tail of small-count brands suggests historical procurement without a vendor strategy, resulting in a fleet where no single maintenance relationship can cover the majority of assets.
Finding 4: Axle Count — New Operational Data
Axle count does not appear in either source system. The NHTSA decode recovered axle count for 1,609 trailers. The fleet is split roughly 45/55 between single-axle (727) and dual-axle (878) configurations. This distinction is mission-critical: a dual-axle trailer typically carries significantly more weight and requires a vehicle with a higher tow rating. Without axle data, tow vehicle assignments cannot be made by specification — they are made by guesswork or institutional knowledge. Encoding axle count into Element or RIM would enable capacity-based dispatch.
Finding 5: Sold Trailers Still in RIM
Cross-referencing Element status against survey records reveals trailers marked Sold or Surplus in the fleet system that still appear in RIM. This could reflect: (a) a data lag where Element was updated but RIM was not; (b) trailers that were sold but remain in use by a chapter; or (c) data entry errors. Regardless of cause, an operational team reading only RIM would believe these trailers are active ARC assets. Each case should be investigated.
Finding 6: Length Discrepancies Indicate Data Quality Issues
Of the trailers where both the RIM "Trailer Size" field and the NHTSA length decode are available, show a discrepancy of more than 1 foot between the reported and decoded lengths. This rate suggests the RIM length field contains a mix of reliable and unreliable data — possibly due to inconsistent measurement convention (interior vs. exterior), typos, or records where the VIN doesn't match the physical trailer. The NHTSA-decoded length, derived from the manufacturer's original specifications, should be treated as authoritative where the decode is clean (ErrorCode=0).
Finding 7: License Plate Expiration Exposure
Element records include license plate expiration dates. As of June 2026, trailers have expired plates. A trailer with an expired plate cannot legally be towed on public roads and would be inoperable for disaster response without remediation. This list is actionable: plates can be renewed without replacing the trailer, and the affected chapters can be notified directly using the driver assignment contact information also present in Element.
Recommendations
- Establish VIN decode as a standard enrichment step for every future Element or RIM export. The NHTSA API is free, requires no authentication, and runs in under two minutes for the full fleet.
- Add axle count to Element as a mandatory field. Until then, use this study's NHTSA-decoded values as the default. Encode this into dispatch and tow vehicle assignment systems.
- Reconcile the 1,034 unsurveyed Element records. Prioritize the oldest cohort (pre-2000) and any Active units with no survey in the past 12 months. A trailer with no survey is a trailer with unknown readiness.
- Investigate the 237 RIM-only records that have no Element entry. Each represents an asset being used operationally without administrative accountability. These should be registered or decommissioned.
- Immediately notify chapters with trailers showing expired license plates. Provide the list to regional operations leads with the driver contact information from Element.
- Flag the Sold/Surplus-in-RIM cases for investigation. Even a small number of these creates operational confusion and potential liability.
- Develop a fleet renewal plan targeting the 2006–2009 cohort. At 17–20 years old, these trailers are approaching end-of-useful-life. The 2018 Kaufman batch provides a procurement benchmark.
Conclusion
This analysis demonstrates that ARC's trailer fleet intelligence was unnecessarily limited by the siloed treatment of data that was always available to be joined. The VIN — a field present in both source systems — is a direct key into a free federal database that adds manufacturer identity, model year, and axle count to every decodable record. The three-way join reveals coverage asymmetries that no single system could surface. None of the findings in this study required new data collection: they required the application of a join, a free API call, and a willingness to look at the data as a unified whole rather than as separate operational artifacts.
Source 1: Element fleet management system export, June 5 2026 (2,242 records) · Source 2: RIM trailer report, June 5 2026 (2,099 records) · Source 3: NHTSA vPIC API
vpic.nhtsa.dot.gov/api/vehicles/DecodeVINValuesBatch/ — free, unauthenticated, 50 VINs per request ·
Join key: 17-character VIN ·
Analysis: Python / June 2026 ·
Master dataset: 2,479 unique VIN records
This tool maps and analyzes the American Red Cross national trailer inventory collected in the June 5, 2026 field survey. It covers 2,099 geocoded trailers and 226 chapter headquarters across all ARC divisions.
- Map & Analysis — Interactive map with filtering and layer controls. Click any trailer dot or chapter HQ to see details in the right panel.
- Charts — Distribution charts for make, age, length, axle count, and division breakdowns.
- Data Quality — Before/after view of how raw RIM text was cleaned into structured data.
- Report Variance — Comparison of April 2026 vs. June 5, 2026 inventory counts by region.
- Our Fleet — Visual reference for the top trailer makes by count, with average age data.
- Color Map By — Changes the color scheme of trailer dots on the map.
- Status / Axle — Click pills to toggle categories on/off. SOLD and WRECKED are hidden by default — these trailers are no longer active fleet assets. Toggle them on if you need to audit decommissioned equipment. SURPLUS trailers are shown by default as they may still be physically present and deployable.
- Length / Age — Drag sliders to set min/max ranges. Tip: set both Age sliders to 0 (Min 0, Max 0) to isolate every trailer with an unknown age — useful for finding records missing a model year.
- Division & Make — Hold Ctrl (Windows) or Cmd (Mac) to select multiple values.
- Chapter — Filters trailers AND shows only that chapter's HQ and drive rings on the map.
- Reset button — Clears all filters and shows all trailers.
- Toggle trailer dots, chapter HQ markers, and drive ring overlays on/off.
- Toggle ARC Geography boundary layers (Divisions, Regions, Chapters, Counties).
- Click any trailer or HQ on the map to see full details in this panel.
The 1-, 2-, and 3-hour drive rings use straight-line (geodesic) distances of approximately 55, 100, and 150 miles respectively. These are estimates only — actual travel time varies by route, traffic, road conditions, and terrain.
Drive rings are drawn around the chapter headquarters address, not around where each trailer is physically stored. A chapter may have trailers deployed across a wide service area — some close to HQ, some hundreds of miles away.
In the example below, the chapter HQ is in Topeka and the rings radiate from there. The blue dot near Salina (western Kansas) is a trailer assigned to this chapter but stored roughly 130 miles from HQ — well outside the 1-hour ring, and near the edge of the 2-hour ring. The rings tell you how far a crew dispatched from HQ could travel, not how far any given trailer is from a disaster site.
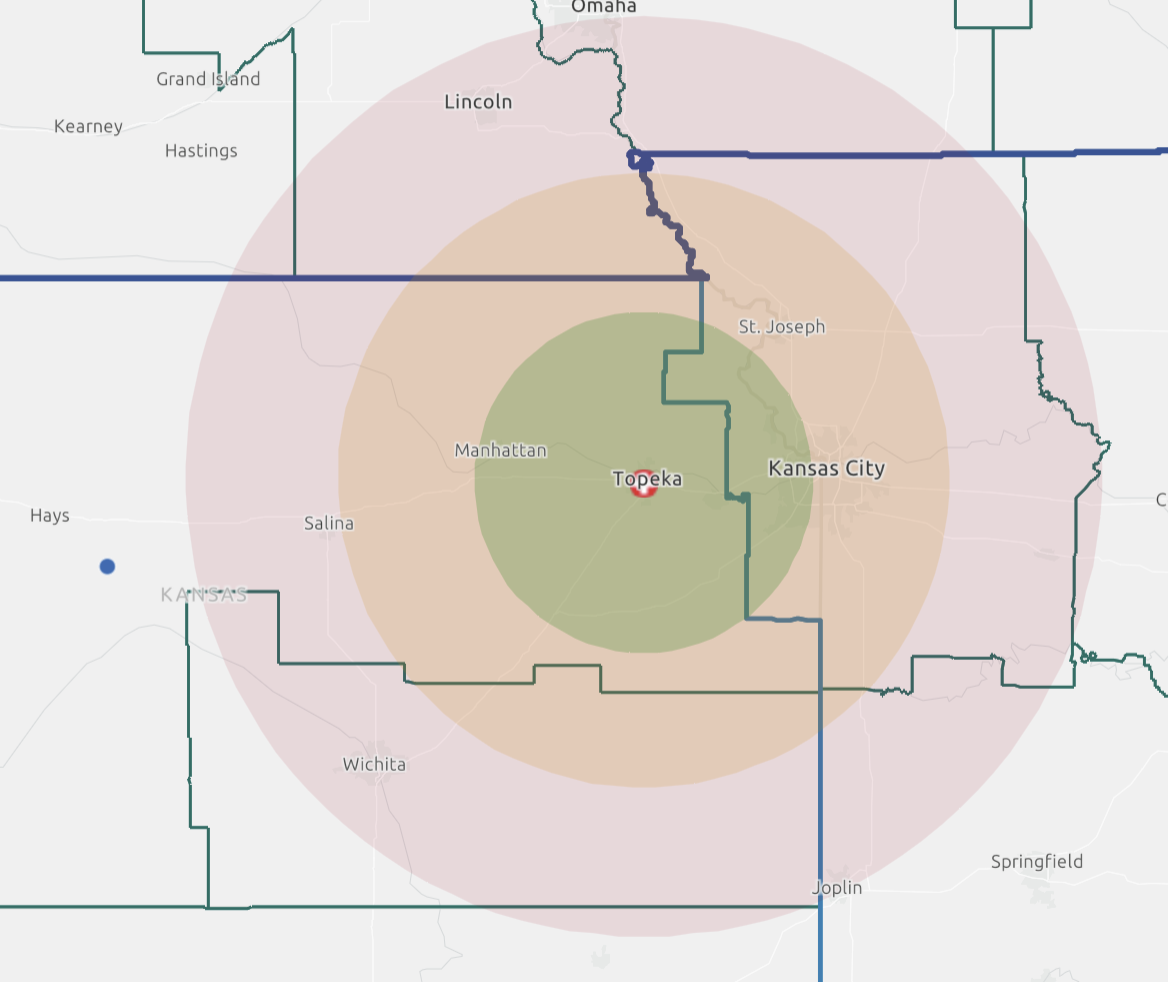
Kansas City/Topeka chapter. The red crosshair is the HQ. The blue dot near Salina is a trailer stored ~130 miles away.
The 1-, 2-, and 3-hour rings are straight-line distance circles — every point exactly 55, 100, or 150 miles from the chapter HQ as the crow flies. They ignore road geometry, terrain, and traffic.
An isochrone is the true geographic area reachable within a given drive time, routed along actual roads. The shape is irregular — stretching far along interstates, contracting around mountains and water. A 1-hour isochrone from Denver bulges east along I-70 and shrinks sharply west into the Rockies.
- Drive rings (this tool): instant, free, client-side — but directional only
- Isochrones: accurate to road network — but require a routing API (ESRI Network Analyst, Mapbox, HERE) and cost credits per polygon
- At 226 chapters × 3 tiers = 678 requests, isochrones are non-trivial to generate or host
- Mountain chapters (Denver, Reno, Salt Lake) — terrain compresses real drive time far inside the ring
- Coastal chapters (Miami, Seattle) — water cuts off half the ring, overstating coverage
- Rural chapters with sparse road networks — ring implies reach that does not exist
Road-accurate isochrones can be added at a later point if routing API access is available.
The Scenario Planner button in the header lets you model "what if" fleet reductions — for example, "What if every chapter kept only 2 shelter trailers?"
- Mode — Choose Fixed Count (e.g. keep exactly 2 per chapter) or % Reduction (e.g. cut 30% from each chapter — proportional, so large chapters lose more and small chapters keep most of theirs).
- Per Chapter / Reduce By — Set the fixed count or drag the slider to set the percentage.
- Prioritize — Choose which trailers to keep: newest, oldest, longest, shortest, or active-only.
- Trailer Type — Apply to shelter trailers only, or all types.
- Chapter Overrides — Expand the accordion to give specific chapters more or fewer than the default. Search by name, type a number. Overrides show an orange badge in reports.
Click Apply Scenario to instantly re-map. A gold banner shows national metrics (chapters, trailers kept, removed, % reduction).
- Save Scenario — Give it a name (e.g. "Option A — Lean"). All settings and chapter overrides are saved.
- Load Saved — Pick a saved scenario from the dropdown. It restores all settings and applies instantly.
- Manage — Delete scenarios you no longer need from the bottom of the dropdown.
- Download Report — Appears in the gold banner after applying a scenario. Generates a standalone HTML file with charts, tables, and full trailer detail.
- The report includes: national summary metrics, before/after charts by division and region, breakdown tables at every level (division → region → chapter), and complete lists of which trailers are kept vs. removed.
- The HTML file works on any computer — just open it in a browser. No app access needed.
- To compare scenarios: Build Scenario A → Download Report → rename the file. Build Scenario B → Download Report. Send both files.
Status and Operable are two independent fields from RIM. A trailer can be marked ACTIVE (still an assigned fleet asset) yet Operable: No (currently down for repair or not road-ready). This is not an error — 11 trailers in the June 5, 2026 RIM data are Active but flagged inoperable. Status reflects fleet lifecycle; Operable reflects current readiness.